/f/82473/1920x1080/4b6801bb0a/markus-winkler-afw1hht0nss-unsplash.jpg)
/f/82473/1920x1080/4b6801bb0a/markus-winkler-afw1hht0nss-unsplash.jpg)
;fill(FFFFFF)/f/82473/2368x3552/d921997b47/andre.jpg)
In this three part series, on getting "Hands-on with Enin", we'll show you how to get the most out of Enin's toolbox:
Part 1: Getting our hands dirty, as we screen for growth tech companies using Enin's Company Browser
Part 2: Getting knee deep, as we integrating Enin's Datasets API with Excel
Part 3: Installing the pipes, as we integrate Enin's Datasets API with Alteryx
Getting the basic filters right
If you're interested in non-fledgling, but growing tech companies, your criteria for screening might be:
Has more than five employees today
Had some income, but less than NOK 2 million in 2017
Located in or around Oslo
Is a "technology" company
Is not part of a corporation
Fairly new
Let's try to implement this screening in Enin's Company Browser. We start out with 2207442 "organizations" in our result set:

This is how many organization numbers we have ever found registered - anywhere. That said, depending on how you measure it, there are between 200k and 300k active companies in Norway. Here active can be defined in many ways, but having at least one employee can be one, or if you want to be less strict you can count a company only if it at least has some revenue.
We want companies which are growing. Let's start with making sure there currently are at least some employees at the companies we are interested in:
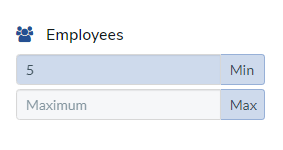
This brings us down to 91200 organizations. Next let's make sure the companies were making some money in 2017. If we were analyzing more mature companies, we might want to use EBITDA (a measure of adjusted profits) for this, but these are pretty young companies and might have still been developing their technology back in 2017. For this reason let's focus on revenu: Let's say that there has been at least some revenu, but no more than 2 MNOK in 2017:

This brings us down to 4163 companies. Sometimes investors have a local mandate, so that they are more interested in businesses in their area. Let's do this for the greater Oslo area:
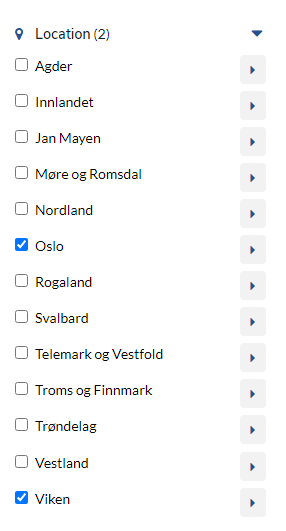
This takes us down to 1413, companies. These are pretty generic companies, let's now focus on finding tech companies.
Finding the right industry using NACE codes
Your first thought might be to use NACE codes alone, say:
58.290 - Utgiv. av annen programvare
58.210 - Utgiv. av programv. for dataspill
63.990 - Andre informasjonstjenester
63.110 - Databeh./-lagring og tilkn. tjen.
63.120 - Drift av web-portaler
62.030 - Forvaltning og drift av IT-system
62.010 - Programmeringstjenester
62.090 - Tjen. tilkn. informasjonsteknologi el.
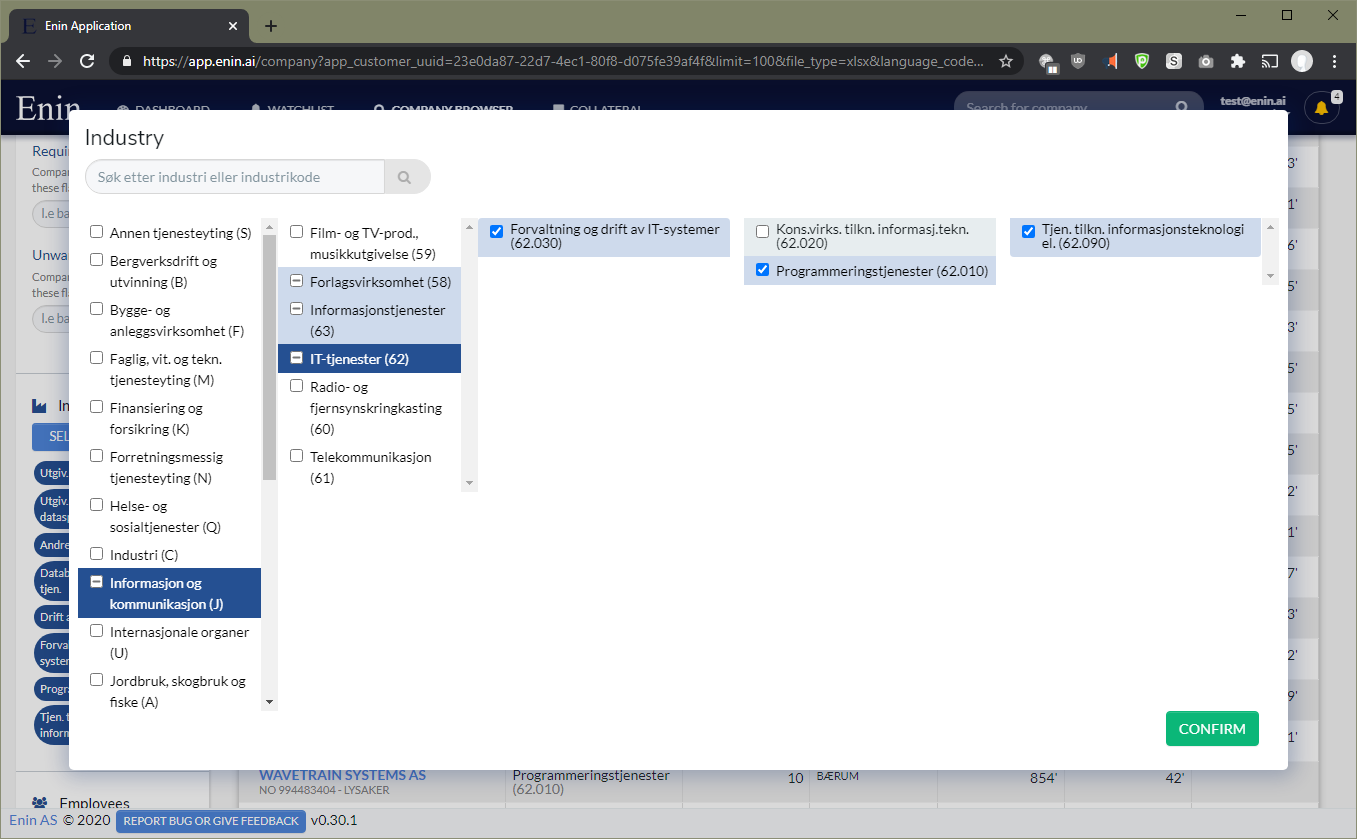
This produces 86 results, and looks something like this:
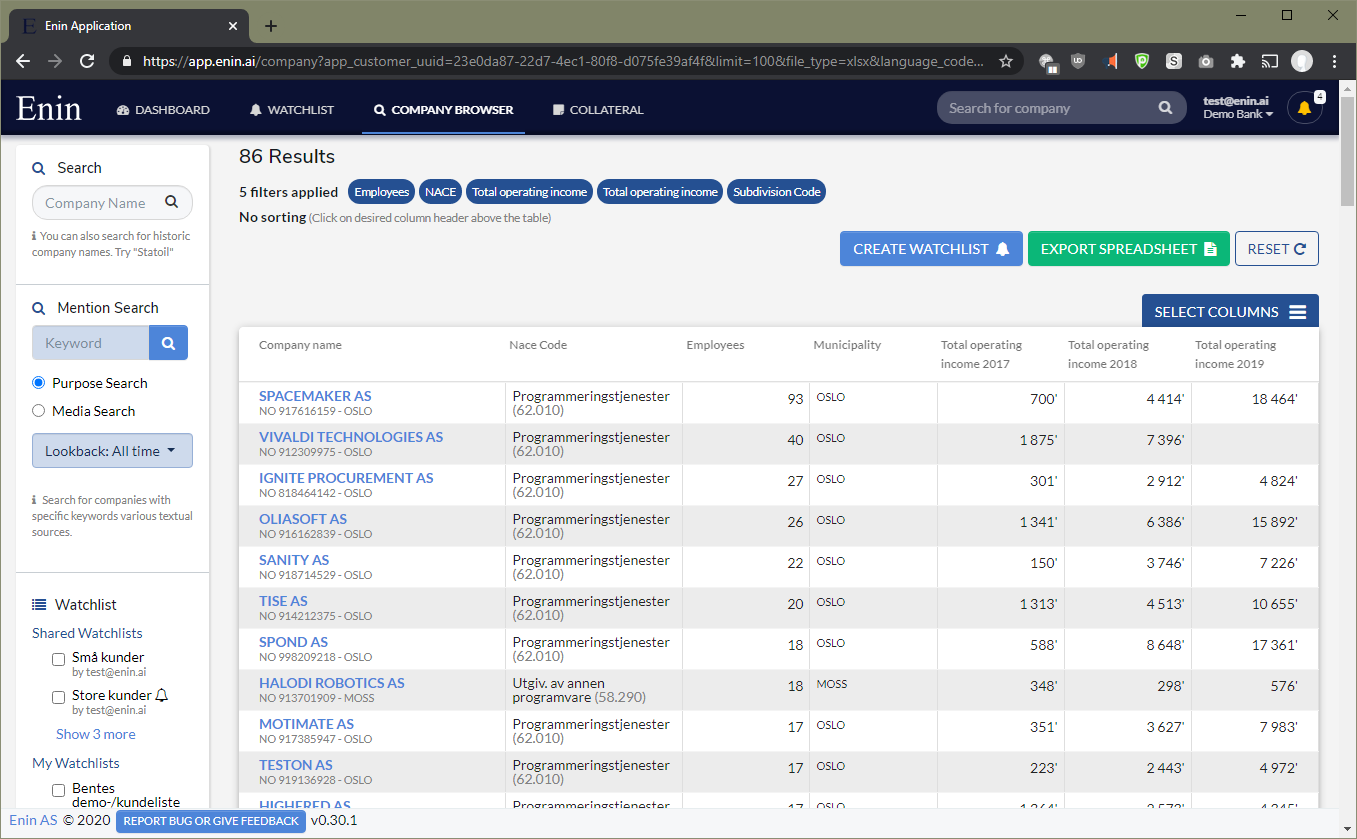
This works fine if you are looking for generic industries like "software development", but what if you are into a more niche categories like "software development for cars"?
Use industry keyword search when NACE codes aren't enough
In that case you might want to use our industry keyword search together with (or instead of) the already set NACE codes. These searches are based on the officially stated purpose (formål) of the company.
Let's keep the software NACE codes, and add the keyword "bil" (car):

This yields only two results because we have already pretty strict conditions set:
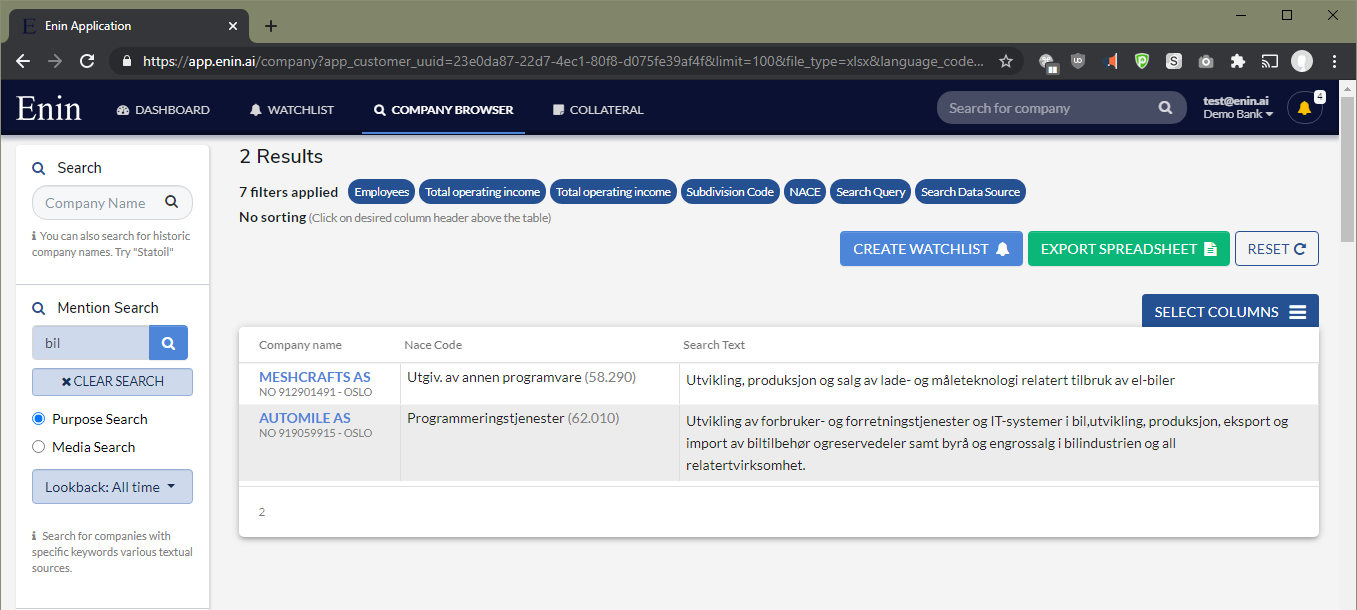
If this was the line of thought we were interested in, then this would be suitable time to loosen up on some of the conditions to get more results.
Keyword based industry search makes it possible to find more niche categories of companies, and are often more accurate and updated than NACE codes.
However, for now let's remove the "bil" filter, and test out how to use keyword filters to ignore companies. Maybe, we as investors aren't really that interested in companies who mention consultancy in their purpose. In that case, we can remove them by using the exclamation mark (!) in front of the keyword, and a trailing colon and asterisk (:*) ending with !konsulent:* which means:
"do not include any companies with a purpose text, which has any word starting with konsulent"
The trailing colon and asterisk (:*) is called a wildcard, and mean "... ending in any other characters", so don't include "konsulent" with any additional trailing characters.
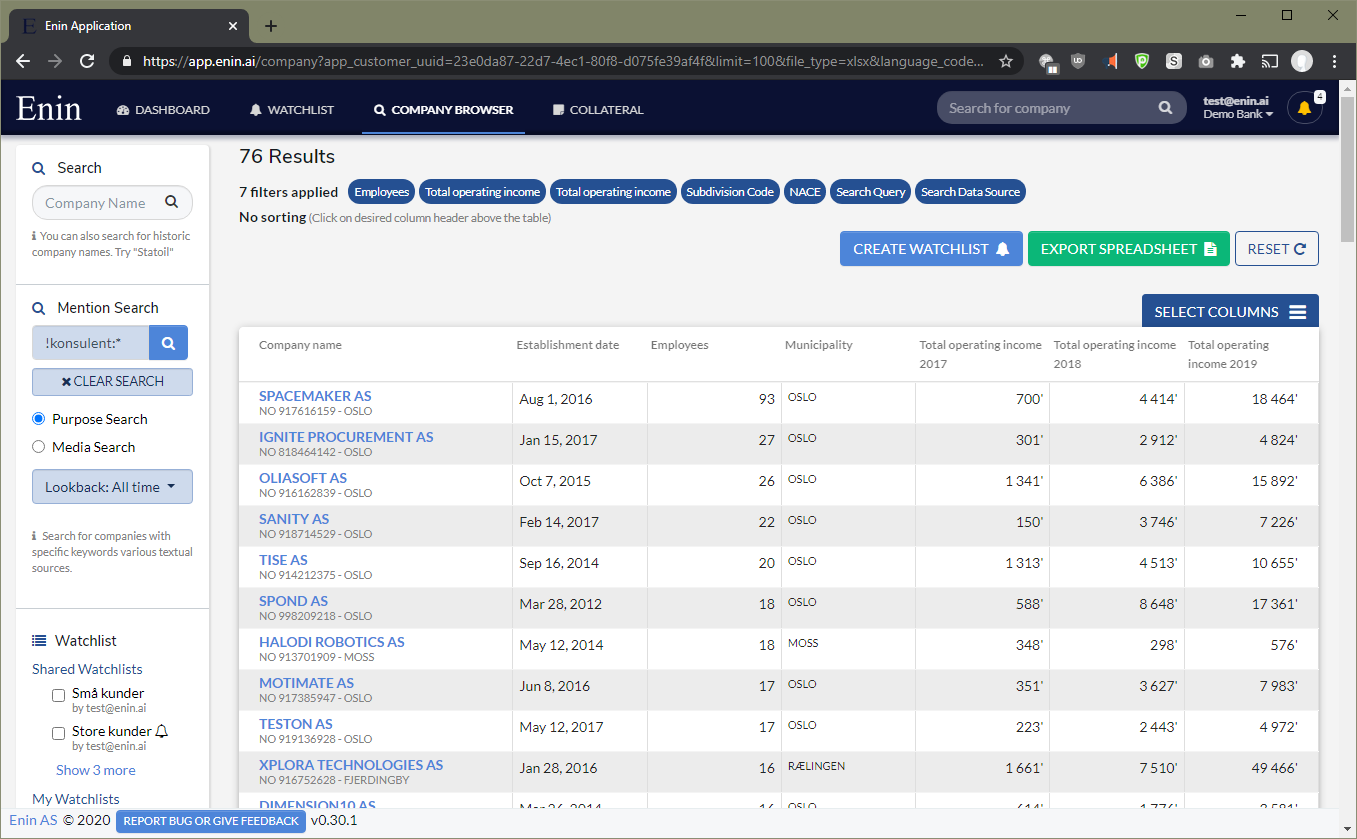
Now we are getting somewhere. In fact, the two top companies here, Spacemaker and Ignite, are in a way sister companies of Enin. Companies which were part of the Arkwright X startup hub, like Enin are now.
Using arbitrary company flags as filters
Finally, there is no point in including companies which we can't invest in. So as our final filter lets remove companies which are part of corporate group:
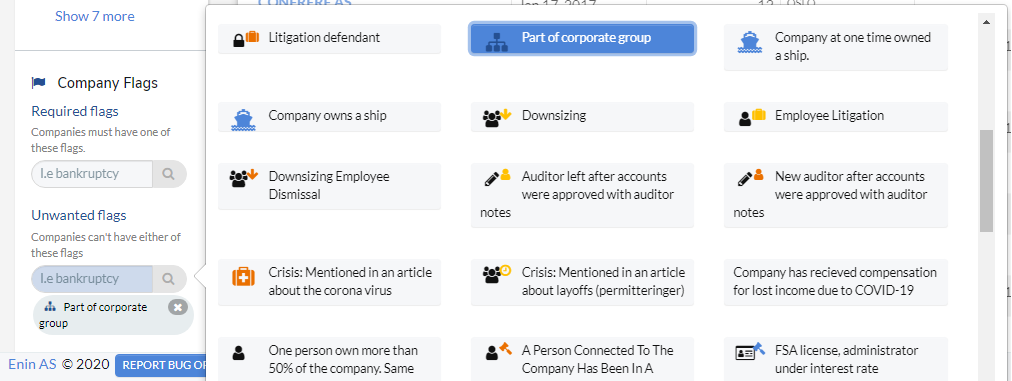
Which brings us down to 58 companies.
Going the extra mile in Excel or our Data Explorer
This final list can then be exported to do further calculations on, say doing some CAGRs, ...

... or could be set up as a watchlists which you can use to monitor for general or trigger events, or even used in our Data Explorer (still in Beta):

Here we have plotted the final selection such that the y-axis is the revenue of the companies, and the x-axis is the ratio between how much cash they have on hand, vs how many employees they have. The lower the revenue is, this could be an indication of remaining runway.
There you have it. Next time we'll be taking this one step further, and doing some of these steps directly from excel, making it possible to do more advanced analyses.